2025 Ranking of Concern
13 out of 39
Water Quality Grade 2025
D
-
 Report Algae Blooms/Fish Kills
-
Have you implemented some best management practices here?
 Let us know!
Report Your BMP Activity
Data Summary
Nutrients
2025
2024
2022
View another community
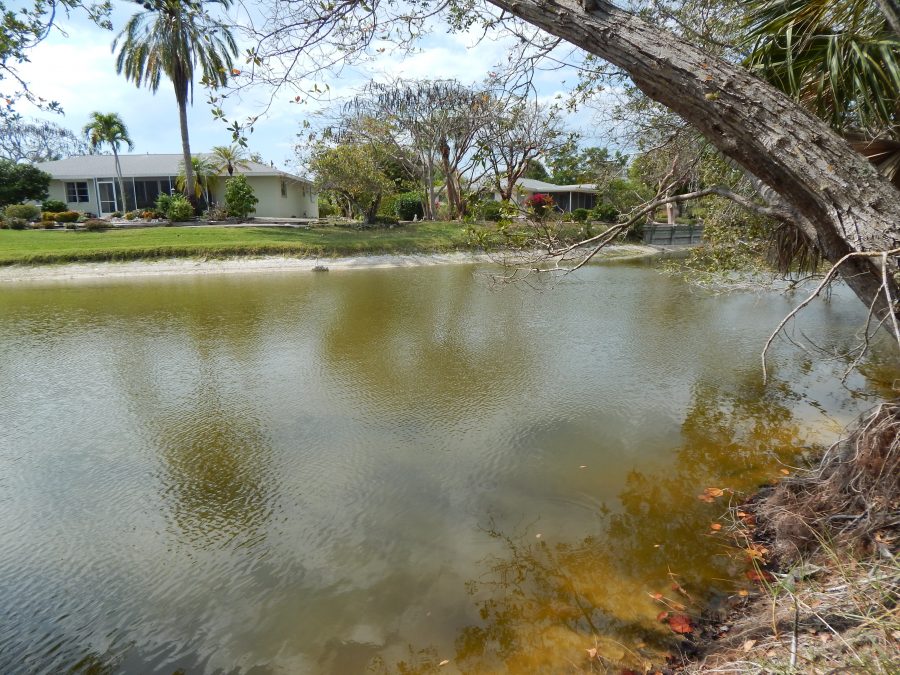
The most recent samples from Gulf Shores were taken in 2025, where it ranked 13 out of 39 sites tested that year. In this dataset, a ranking of 1 represents the most impaired site, while 39 represents the least impaired.
. . . . . = State Criteria: measurements above this line suggest impairment to the waterbody.
Historical Data
Rankings
- 2025 Ranking: 13 out of 39 sites tested
- 2024 Ranking: 3 out of 46 sites tested
- 2023 Ranking: Not tested
- 2022 Ranking: 41 out of 84 sites tested
- 2020 Ranking: 75 out of 84 sites tested
- 2018 Ranking: 43 out of 78 sites tested
- 2016 Ranking: 38 out of 78 sites tested
Water Quality Grade
- 2025 Grade: D
- 2024 Grade: F
- 2023 Grade: Not tested
- 2022 Grade: D
- 2020 Grade: D
- 2018 Grade: D
- 2016 Grade: C
Most Impaired - Top 5
Least Impaired - Top 5
-
39Beach Road Villas
-
38East Rocks: Coquina Drive
-
37Bright Water
-
36Sea Oats
-
35Sanibel Hamlet

 Share on Facebook
 Share on Twitter
